"Good GDP"
Assessing the Strengths and Weaknesses of Gross Domestic Products (GDP)
We know that GDP (Gross Domestic Product) is a meaure of a nation's production of goods and services. But why does it matter? And how does it indicate a country's strength? Furthermore, what makes up the American GDP so high, even though our “G”, in the equation, is so weak?
Let’s explore the strength of exports of the United States and the consumption of its individuals.
Let’s explore the strength of exports of the United States and the consumption of its individuals.

Part I: Current GDP
Let's start by measuring the components of the current GDP, that is: "What makes up America's GDP"? We'll be using a website called "GapMinder" to better understand our nation's economic ability.
***Below is a "screen shot" of what you'll see on the website. Note that you can check the "United States" box on the right to highlight only our country. Furthermore, you can hold your mouse over the X- and Y-axes to show that they mean. And you can press PLAY at the bottom to see changes over time.
***Below is a "screen shot" of what you'll see on the website. Note that you can check the "United States" box on the right to highlight only our country. Furthermore, you can hold your mouse over the X- and Y-axes to show that they mean. And you can press PLAY at the bottom to see changes over time.
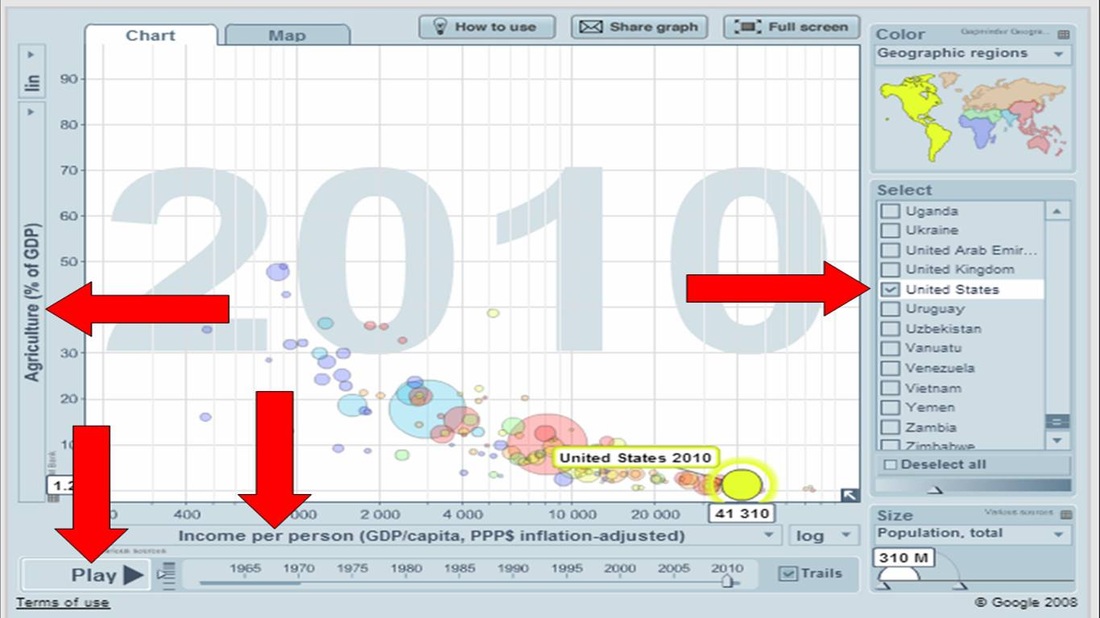
1. agricultural gdp
Click here to get started. This website shows what percent of a nation's GDP comes from the sale of agricultural goods (wheat, corn, cotton, etc.). While viewing that graph, pay attention to specific countries, general trends, and draw "predictions" for what the next years might show. And when you're done, provide a simple "K, what...So, what...Now, what"-form of analysis. The following questions are designed to help guide your thoughts. You don't have to answer these questions! These are just designed to help guide your thoughts. Remember that isn't turned in for a grade.
- Note that the "size" of the bubbles is based on population...not strength or power. Therefore, the sizes of China and India's respective bubbles are quite large.
- For the United States, they are in an interesting position: only a small percentage of people work in agriculture. Is this good? Bad? Compare them with other countries like of Guatemala and Ethiopia. Explain where they are on the "agriculture-to-income" ratio scale.
- Press PLAY. What has happens to the agricultural shares of most countries over time?
- Of the countries of China and India, which is in the "better position"? Why?

|
Make a conclusion statement about agricultural GDP. It can be about the United States, or countries in general. Use the following sentence starters:
|
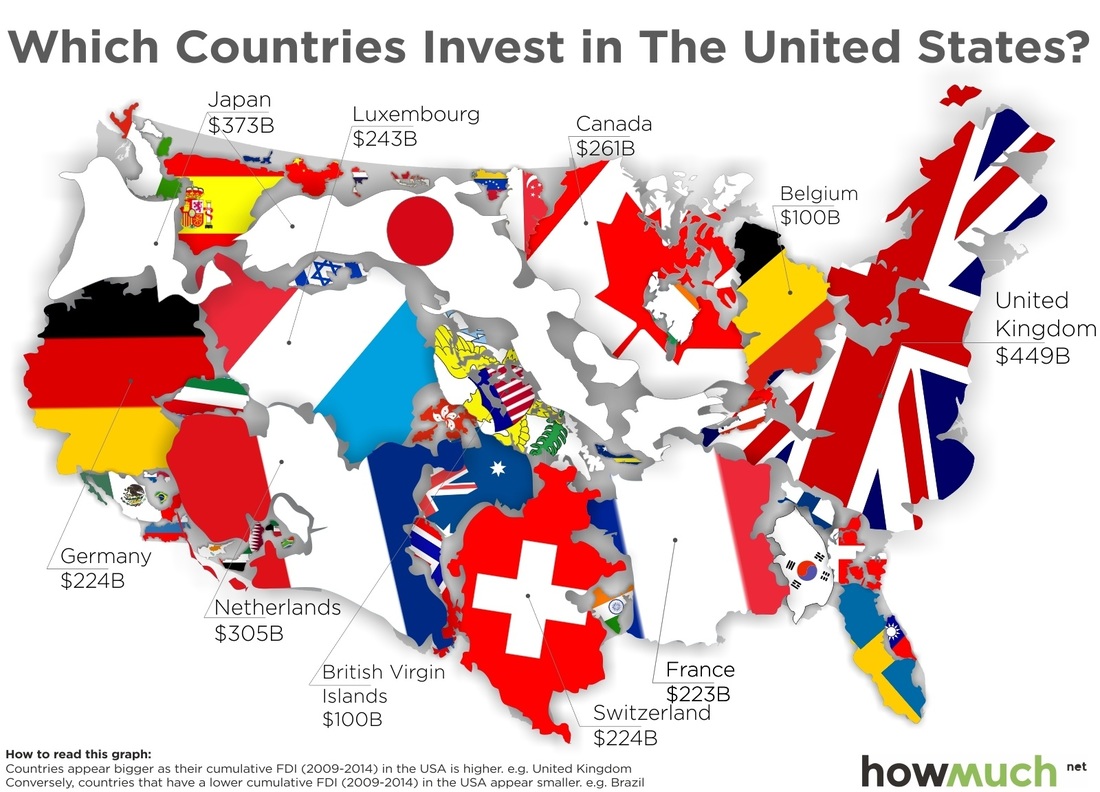
2. foreign investment
Click here to get started. This website shows the amount of money foreign countries and businessmen "invest" in other countries. In other words, how much of "someone else's money" is inside of another... While viewing that graph, consider the questions below.
- Most countries on this map hover around the 0-5% mark, which means that their economy is not "owned" by foreigners. Look at the countries of Luxembourg and Hungary. They are both "extreme" countries, yet you DON'T want to be either one of them. Why?
- Press PLAY. What has foreign investment done to the Chinese and Indian income over time? (HINT: Focus on the movement along the X-axis...)

|
Make a conclusion statement about the percentage of GDP that comes from foreign investment. It can be about the United States, or countries in general. Use the following sentence starters:
|
3. industry
Click here to get started. This website shows what percent of a nation's GDP comes from the sale of industrial supplies (oil, steel, lumber, equipment, etc.) While viewing that graph, consider the questions below.
- What happens to most countries over time?
- Look at Saudi Arabia (in the upper right). There's a great situation: tons of money from a lot of exports. THINK: What export makes them the most wealthy?

|
Make a conclusion statement about industrial GDP. It can be about the United States, or countries in general. Use the following sentence starters:
|
4. services
Click here to get started. NOTE: FOR SOME REASON, THE U.S. DOES NOT SHOW UP ON THIS MAP! So, you have to "click" the U.S. in the box on the right to show it...
This website shows what percent of a nation's GDP comes from the sale of "services" (labor, health care, hotels, restaurants, entertainment, etc.) "Services" are things you can't actually "touch"; you can't touch "entertainment", like you can "touch" corn, for example
While viewing that graph, consider the question below.
- Press PLAY: What happens to most country's services over time? Which countries are at the "top"? At the "bottom"?

|
Make a conclusion statement about the percentage of GDP that comes from services. It can be about the United States, or countries in general. Use the following sentence starters:
|
5. IMPORTS
Click here to get started. This website shows how much money a nation spends on imports. In other words, how much do they import? Remember in our GDP formula, you want your imports to be LOW. While viewing that graph, answer the questions below.
- Take a country like Hong Kong in the upper right. Why are they in a bad position?
- Press PLAY. What has happened to American imports over time?
- Do the same for Hong Kong. Remember, you can check the Hong Kong box on the right to isolate that one country. What has happened to Hong Kongian imports over time?

|
Make a conclusion statement about the impact of imports on GDP. It can be about the United States, or countries in general. Use the following sentence starters:
|
* conclusions. Please answer the following questions:
- Add it up all up: In terms of the % of GDP, how much does the United States "make" from the "sale" of...agriculture?...foreign investment...industry...services? (NOTE: This percentage should be over 100%...)
- But, GDP doesn't measure "imports"! Remember, GDP measures "goods and service" produced within your country! So, how much should we, as the United States "subtract" from our overall GDP percentage from our "buying" of imports? Provide the % amount.
- Overall conclusion: What makes our GDP the strongest / biggest?
- Overall conclusion: What did you learn from this first part of the activity?
Part II: How We Doin'?

|
We know that the American GDP is quite large, and mostly because of the high amount of services we provide, in addition to the sale of agriculture and our acceptance of foreign investment. Our $17 trillion makes us almost "superhuman". But how are we doing as a country? A high GDP does NOT necessarily mean the highest quality of life. So, how're we doing?
Click here to access a website, called IfItWereMyHome.com. It's kinda fun to see how the U.S. compares, in size, with Canada (the first example), but how else do we compare? |
This is what I want you to do: just get a watershed of information on how the U.S. compares to others. Compare the U.S. with 10 other random countries. Then 20 others. Whichever you choose. Do you see "general trends" that we do "better" than them? But more importantly, were do "they" do better than "us"? You might wanna jot some notes down, but again, all you need to compare the U.S. to as many countries as possible in order to get the "sample size" of comparison. When you're done, conclude:
- What "unmeasurable things" (things you can't put a "price tag" on) could be added to our GDP that would actually INCREASE the $17 trillion of our economy?
- What "unmeasurable things" (things you can't put a "price tag" on) could be added to our GDP that would actually DECREASE the $17 trillion of our economy?
